Table of Contents
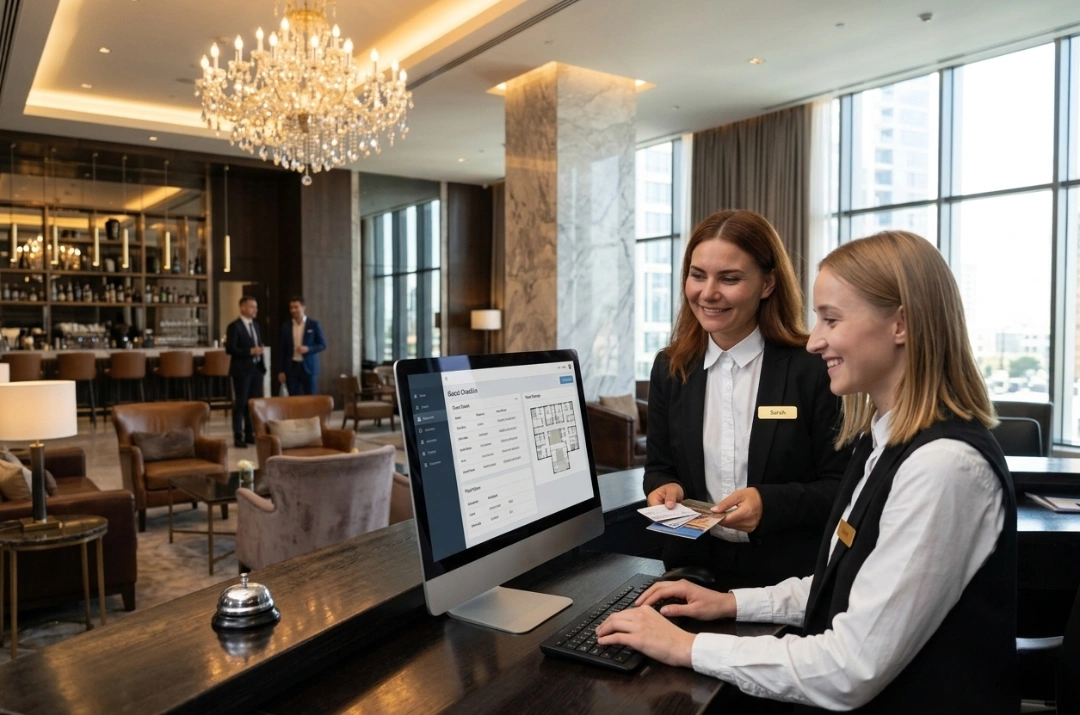
Join Thousands of Hotels Thriving with roommaster
The transition to roommaster is straightforward and efficient. Our implementation team handles data migration including reservations, guest profiles, and historical information.

Have you ever wondered why your hotel’s revenue keeps rising but your profit feels like it's shrinking?
That question has become a real issue for hoteliers worldwide, and the data now shows exactly why.
For example, U.S. hotels through Q3 2025 saw revenue underperform budget expectations, with actual revenue per available room (RevPAR) running about 9% below budget at $119.22. However, the gross operating profit margins held only modestly below target at 37.7%. This suggests sharp focus on cost control, not just top-line growth, has become essential to protect profits.
A hotel profitability analysis helps you see the whole picture. It connects effort to outcome and shows what actually works and what quietly drains results. This guide walks you through the process step by step. You will learn how to measure profitability, interpret the numbers, and turn insights into actions that support long-term success.

Many hotels stay busy without staying profitable. High occupancy does not guarantee strong results. A full house with poor pricing or bloated costs can still underperform.
Profitability analysis helps separate activity from impact. Here are a few reasons you should measure your hotel’s profit margins:
Stronger profit margins also put you in a safer, more flexible position. They increase your hotel’s value if you decide to sell and help you stay resilient when unexpected events hit, like the COVID-19 pandemic.
Metrics turn raw numbers into actionable insights. Without them, reports feel overwhelming and disconnected.
Let’s break down the most important hotel profitability metrics one by one.
Return on investment (ROI) evaluates the total investment made in the hotel and shows the profit earned from that investment. In simple terms, ROI tells you how well your money works for you.
Here’s how you can calculate ROI:
Return on Investment (ROI) = (Operating Income/Amount Invested) × 100
This metric helps you compare the profit your hotel generates against the capital you invested, including both owned and borrowed funds.
Suppose you invested $10 million in your hotel and earned $1.5 million in operating income.
ROI = ($1.5 million/$10 million) × 100 = 15%
This result means your hotel earns a 15 percent return on the capital invested.
Return on equity (ROE) ratio measures the profit your hotel earns compared to the equity invested by owners or shareholders. It focuses on how well the business rewards its risk capital.
Return on Equity (ROE) = (Annual Net Income/Net Equity) × 100
ROE shows how effectively the hotel generates returns for its owners. A strong ROE should at least match or exceed the returns from low risk investments such as government bonds. When ROE exceeds the amount shareholders invested, the hotel creates real value.
If your hotel earns $800,000 in annual net income and has $5 million in owner equity,
ROE = ($800,000/$5,000,000) × 100 = 16%
This result shows that the hotel generates a 16 percent return for its owners.

This ratio works well for understanding your hotel’s profit margins. ROS compares operating profit to total sales and shows how much profit you keep from every rupee earned.
To calculate ROS, divide operating profit by net sales and multiply the result by 100.
Return on Sales (ROS) = (Operating Profit/Net Sales) × 100
This metric helps you evaluate operational efficiency. It also allows you to compare your hotel’s profitability with competitors of similar size and market segment.
For example, if your hotel earns $4 million in net sales and generates $600,000 in operating profit,
ROS = ($600,000/$4,000,000) × 100 = 15%
This result means your hotel keeps 15 cents in profit for every dollar of sales.
The Gross Operating Profit margin ranks among the most important metrics in hospitality. It measures how effectively your hotel generates profit from core operations before fixed costs like taxes, interest, depreciation, and amortization.
GOP Margin = (Gross Operating Profit/Total Revenue) × 100
Gross operating profit equals total revenue minus operating expenses such as labor, utilities, housekeeping, and maintenance. A higher GOP margin shows strong cost control and healthy operations.
If your hotel generates $10 million in total revenue and reports a GOP of $4 million, the GOP margin is,
GOP Margin = ($4 million/$10 million) x 100 = 40%.
This result means the hotel retains 40% of its revenue as operating profit before fixed costs.
Return on Assets shows how efficiently your hotel uses its assets to generate profit. Hotels rely heavily on physical assets such as buildings, furniture, and equipment, making this ratio especially valuable.
ROA = (Net Profit/ Total Assets) × 100
If your hotel owns assets worth ₹50 crore and earns ₹5 lakh in net profit,
ROA = (₹5,00,000/ ₹50,00,00,000) × 100 = 1%
A higher ROA signals effective asset utilization. A lower ROA may point to underperforming assets or the need for better asset management decisions.
Revenue Per Available Room (RevPAR) measures how well your hotel fills rooms and at what price. It combines occupancy and room rate into one powerful metric.
RevPAR = Room Revenue/Available Rooms
Or
RevPAR = Average Daily Rate × Occupancy Rate
This metric helps you understand overall room revenue performance and compare results across different periods or competitors.
If your hotel has 100 available rooms and generates $600,000 in room revenue for the month,
RevPAR = $600,000/100 = $6,000
This result means each available room generates $6,000 in revenue over that period.
Occupancy rate shows the percentage of available rooms sold during a specific period. It highlights the demand for your hotel against market demand.
Occupancy Rate = (Rooms Sold/Available Rooms) × 100
A high occupancy rate signals strong demand, while a low rate may indicate pricing or marketing challenges.
If your hotel has 120 available rooms and sells 90 rooms,
Occupancy Rate = (90/120) × 100 = 75%
This result means guests occupy three out of every four rooms.
Average Daily Rate (ADR) reflects the average price paid for rooms sold. It focuses on pricing power rather than volume.
ADR = Room Revenue/Rooms Sold
ADR helps you assess how well your hotel positions itself in the market and whether pricing strategies align with guest expectations and demand levels.
For instance, if your hotel earns $800,000 in room revenue from selling 80 rooms,
ADR = $800,000/80 = $10,000
This figure shows the average price guests pay per room.
TRevPAR, or Total Revenue Per Available Room, measures the total operating revenue of a hotel. This includes room revenue, food and beverage sales, events, and other business revenue. Essentially, it accounts for every way your property generates money.
TRevPAR = Total Hotel Revenue/Total Available Rooms
If your hotel generates $20,000 in total revenue for a day and has 100 rooms,
TRevPAR = $20,000/100 = $200
This means each available room earns $200 in revenue from all sources on that day.

Profitability analysis relies on strong, reliable inputs. You do not need perfect data, but you do need data you can trust and track consistently.
Here are some of the data sources for profitability analysis:
📌Interesting read: Implementing Dynamic Pricing in Hospitality Industry

A strong profitability analysis happens when you move through the numbers in a logical order and ask the right questions at each stage. This 7-step framework gives you a repeatable way to do exactly that, without getting lost in complexity.
Most hotels start profitability analysis by looking at total sales. That is understandable, but it is also where many analyses stop too early.
At this stage, your goal is to understand where money actually comes from and how reliable each source is. Instead of asking, “How much did we earn this month?” ask:
For example, two months may show similar top-line numbers. One month may rely heavily on discounted online bookings, while the other may include more direct bookings and paid add-ons. The second month often supports healthier outcomes, even if revenue looks similar.
{{booking-engine-one}}
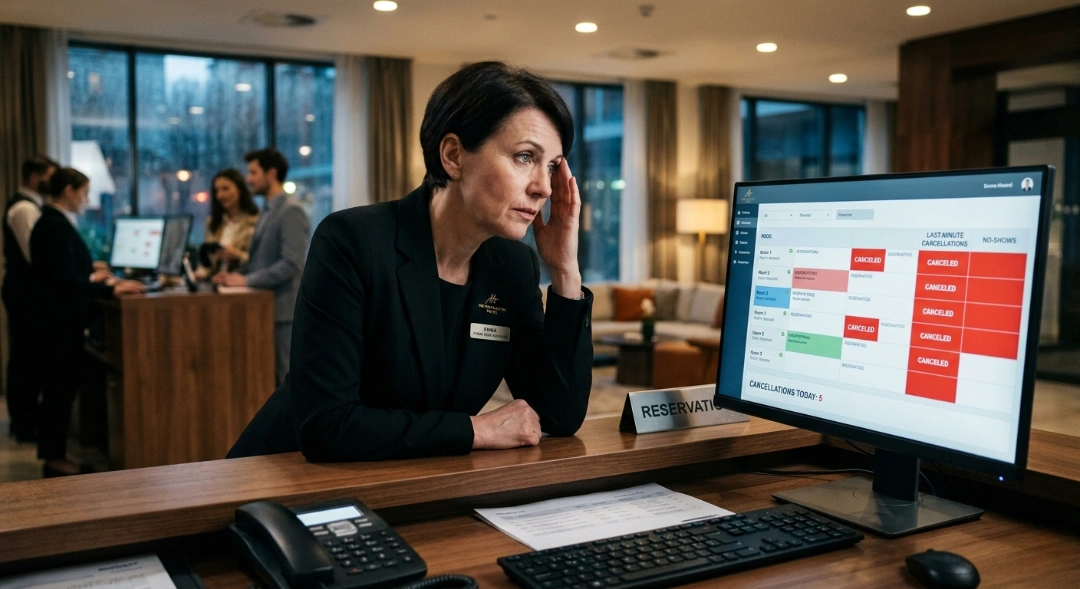
Once you understand revenue, shift your focus to spending. Costs tend to grow quietly. Profitability analysis brings them into the light. Some expenses exist regardless of occupancy. Others rise and fall with demand. When you separate these, you gain control.
For example:
This separation helps you forecast accurately and avoid overreacting during slow periods.
However, avoid lumping everything into broad categories. When possible, assign costs to the departments or functions that generate or consume them. When a department owns its numbers, accountability improves naturally.
Every department plays a different role in the business. Some drive income. Others support experience and loyalty. Profitability analysis helps you understand both.
Rooms usually carry the highest contribution, but only when pricing, occupancy, and staffing align. So, look closely at:
A small pricing adjustment or scheduling change can often unlock meaningful improvement.
Food service, wellness, and other amenities may not always aim for maximum contribution. Some exist to enhance guest satisfaction and brand perception. Profitability analysis does not mean cutting these areas blindly. It means understanding what they return, whether financially or strategically.
Labor often represents the most complex and emotional part of profitability analysis. It also offers the biggest opportunity for improvement when handled thoughtfully.
Compare staffing schedules with actual occupancy and activity. Look for patterns like:
Even small adjustments can reduce waste while improving team morale.
Instead of focusing only on hours worked, focus on outcomes. Rooms cleaned per shift, check-ins handled per agent, or tables served per staff member often tell a clearer story. Productivity metrics turn labor discussions from opinions into facts.
One month rarely tells the full story. Trends matter more than snapshots.
This perspective prevents overcorrection and builds confidence in decision-making.
Internal numbers only tell part of the story. External context completes it. Compare performance to similar properties in your area or category. This helps answer critical questions:
Context reduces frustration and sharpens strategy.
The final step matters the most. Focus first on improvements that reduce waste or improve efficiency without harming guest perception. These often deliver the fastest wins.
Every insight should lead to a specific action, a responsible owner, and a review date. This turns analysis into momentum. For example, instead of saying, “Labor feels high,” say, “We will adjust weekend scheduling for the next four weeks and review results.”
That clarity builds trust and follow-through.
Many hotels struggle with profitability analysis not because it lacks value, but because it feels complex. The process often appears harder than it actually is, especially without a clear structure.
Let’s understand some of these challenges.
Today’s top hotels use data to fine‑tune pricing decisions, expand contribution beyond rooms, and align daily operations with long‑term goals. These practices help convert insights into action that strengthens financial performance.
Pricing sits at the heart of hotel revenue performance. Dynamic pricing tools now allow hotels to adjust rates in real time based on demand and competitive behavior.
A modern, fully upgraded, cloud-based property management system (PMS) like roommaster PMS offers a suite of integrated tools to streamline operations, maximize revenue, and improve guest experiences. For example, roommaster’s Revenue Optimization and the Rate Management software bridges the gap for independent hotels by automating intelligent, rule-based pricing.
Its yield engine continuously analyzes market conditions, booking pace, and competitor rates to make smart rate adjustments. Hotels can define their pricing strategy once, and the system works around the clock, maximizing revenue during high-demand periods while optimizing occupancy during slower times. With real-time automation, properties often see 15–35% increases in RevPAR in the first year.
This shift from static to dynamic pricing prevents underpricing and helps capture high‑value segments during peak demand periods.
{{pms-one}}
Room sales remain the largest slice of revenue, but hotels that diversify income perform better overall. What makes this approach powerful is how it interprets data.
The roommaster Revenue & Finance Suite tracks performance across rooms, F&B, spa, events, and ancillary services, while the ampliphi RMS integration ensures every automated update flows into the channel manager, booking engine, and PMS. This eliminates duplicate or incorrect data while keeping pricing and promotions accurate.
Properties can now run targeted promotions, create bundled packages, and optimize ancillary revenue. For example, spa packages, premium dining offers, or bundled experiences can generate incremental revenue without requiring additional room nights, all managed from a single platform.
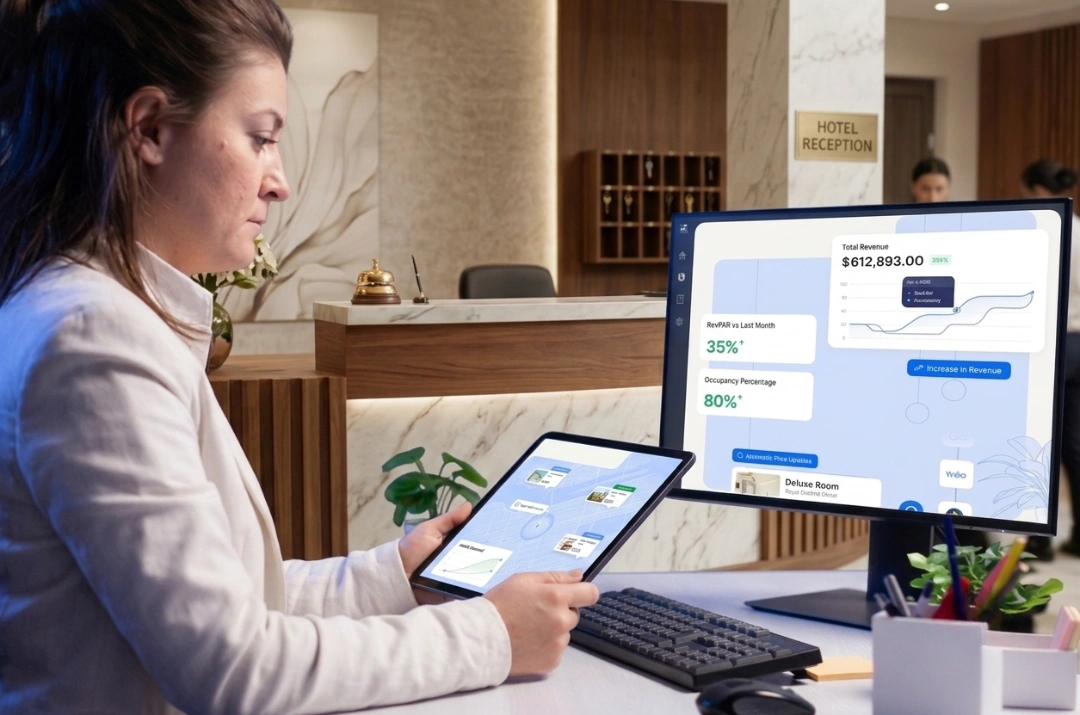
roommaster PMS also includes Hotel Reporting Software with 270+ built-in reports and a custom report builder, turning raw data into revenue-driving decisions. Hotels can track performance across channels, seasons, and guest segments without juggling spreadsheets.
With instant visibility, properties can answer questions like:
Automated reports can be exported, filtered, and scheduled for stakeholders, giving leadership the intelligence to act quickly and confidently.
Profitability analysis also uncovers cost patterns and workflow inefficiencies. Hotels can use roommaster Operations Suite tools, including Front Desk Management, Housekeeping, Group Blocks, and Reporting & Analytics, to forecast demand, adjust staffing, and refine service delivery.
Integrated data allows pricing strategies from the Revenue & Finance Suite to tie directly to guest preferences, seasonal trends, and local event calendars. Combined with roommaster Concierge, staff can focus on high-value guest interactions while AI handles 24/7 call management and booking conversion.
This alignment ensures operational decisions consistently support profitability goals, turning proactive insights into measurable improvements in efficiency, revenue, and guest satisfaction.
How Wood River Inn gained confidence with roommaster
Since 1998, Wood River Inn has thrived as a distinctive 57-room independent property. When owner Ryan Allison sought technology to enhance operations without compromising the hotel’s unique identity, he turned to roommaster’s comprehensive PMS and Revenue & Finance Suite.
With roommaster’s unified systems, Wood River Inn eliminated the “swivel chair” problem of switching between multiple platforms. Staff now manage reservations, operations, and revenue from one intuitive interface, saving 4 hours daily and gaining complete visibility into hotel performance from anywhere.
Ryan explains,
“I don’t have to worry about back-office stuff. We can focus on selling hotel rooms.”
The integrated booking engine drove a 57% increase in direct bookings, boosting margins by eliminating OTA commissions while strengthening guest relationships. Combined with remote access and real-time analytics, Ryan can adjust rates, monitor arrivals, and make informed decisions without being on-site.
Ryan credits the success to the partnership approach:
“roommaster is an upfront, honest, people-oriented company," making Wood River Inn "proud to be a partner”.
This story shows how the right technology delivers confidence, operational efficiency, and measurable revenue growth for independent hotels.
Consistency matters more than complexity when it comes to understanding hotel performance.
The smartest move to improve your hotel’s profitability is to invest in a comprehensive platform like roommaster. Why deal with multiple systems when one solution unifies operations, revenue, and guest engagement?
With roommaster PMS, you can gain everything you need to grow your profit margin and streamline hotel management.
roommaster brings all these capabilities together in one platform, one login, giving hoteliers the confidence, insight, and control needed to grow profits and elevate every guest experience—anywhere, on any device. Book a demo today to get started!
Hotel profitability analysis evaluates income and expenses together. It helps hotels understand what truly drives results and identifies areas for improvement.
Monthly reviews offer the best balance between insight and effort. They keep performance visible without overwhelming the team.
Margins, labor efficiency, and department contribution provide strong indicators of overall performance. Tracking these metrics helps guide strategic decisions.
Subtract department expenses from department revenue to measure contribution. This shows which areas generate the most profit and which need attention.
Small hotels perform profitability analysis with spreadsheets and consistent reporting, which still deliver meaningful insights. Tools like roommaster PMS can simplify data collection and provide structured reports for hotels of all sizes, including independent and small hotels.
Revenue analysis tracks sales figures. Profitability analysis goes further to explain why results occur and highlights cost efficiency.
Seasonality affects comparisons, so adjust expectations and benchmarks accordingly. Understanding these trends helps with forecasting and planning staffing or pricing.
Focusing only on revenue, ignoring labor efficiency, and avoiding uncomfortable findings are frequent mistakes. Using roommaster PMS can highlight these gaps with clear, real-time reporting.
It aligns daily decisions with financial goals and long-term sustainability. roommaster PMS provides actionable insights so teams can make data-driven operational improvements.
{{cta-strip}}


The transition to roommaster is straightforward and efficient. Our implementation team handles data migration including reservations, guest profiles, and historical information.
See how roommaster's unified platform can work for your property. Our team will walk you through features tailored to your specific needs and operations.