Table of Contents
Join Thousands of Hotels Thriving with roommaster
The transition to roommaster is straightforward and efficient. Our implementation team handles data migration including reservations, guest profiles, and historical information.
Most hotels collect plenty of data, but few truly know what those numbers actually say about their performance. Hotel KPIs like occupancy rate, RevPAR, ADR, and GOPPAR give a tangible shape to the patterns of your bookings, cancellations, and expenses. They show a measurable state of your hotel’s profitability and spot gaps that might otherwise go unnoticed.
Hotel key performance indicators turn raw information into direction. Understanding these numbers helps you make accurate decisions quickly, whether that’s adjusting room rates, rethinking promotions, or improving how your team operates.
In this article, we will look closely at the key hotel performance metrics and how they guide better revenue management, smarter strategy, and long-term growth of your hotel.

Hotel performance metrics are measurable data points that track how a property performs in key areas like hotel revenue, occupancy, and guest satisfaction. They help you understand whether current strategies are actually driving growth or simply filling rooms without much profit.
When measured regularly, these key hotel metrics act as a reality check into your operation’s efficacy. They can:
Hotel performance metrics matter because they give you definitive clarity into what’s working and what’s not. Without them, it’s easy to mistake activity for progress. But with them, every part of the operation, from housekeeping to hotel revenue management strategies, aligns with a clear goal: delivering consistent profits and better guest experiences.
{{revenue-management-one}}
Hotel revenue metrics show whether your rooms, rates, and resources are working together to generate expected profit. Understanding these numbers helps you spot trends, identify missed opportunities, and make smarter pricing decisions. Here are the five most important ones you must measure:
Average Daily Rate or ADR shows how much revenue each of your occupied rooms generates in a given period. It’s one of the most common revenue metrics in the hotel industry and helps track how effectively you are pricing and selling your rooms.
ADR = Total room revenue ÷ Number of rooms sold
For example, if your hotel earns $20,000 from 100 rooms sold, your ADR is $200
For example, let's say a nearby hotel’s ADR is $250 and yours is $180. In that case, you might be underpricing your rooms. Say your occupancy rate rises from 75% to 90% but ADR stays at $180, you are filling more rooms without actually earning more per stay.
It might look profitable at first. However, the costs of cleaning, utilities, and staff can cut into the extra revenue from higher occupancy, leaving your gross operating profit thinner despite being busier.
Occupancy rate is the percentage of available rooms that are sold over a specific period. It gives a clear picture of demand and how well your property converts available inventory into booked and occupied rooms.
Occupancy Rate = (Number of sold rooms ÷ Number of available rooms) X 100
If your hotel sells 80 out of 100 available rooms, your occupancy rate is 80%.
Let's say your occupancy rate is 60% during a peak season; it signals underperformance, and you should adjust pricing, promotions, and marketing efforts. On the other hand, an occupancy rate consistently above 90% suggests high demand. But it could also mean you have opportunities to increase room rates without losing bookings.
Revenue per Available Room, or RevPAR, is a hotel performance metric that measures how much of the hotel's room inventory is sold and the revenue generated from those bookings. It combines occupancy rate and ADR into a single metric, showing how well your hotel generates revenue from its total room inventory.
RevPAR = Total room revenue ÷ Number of available rooms
Or,
RevPAR = ADR x Occupancy rate
For example, suppose your hotel earns $20,000 in revenue and has 100 available rooms. Your ADR is $250, and your occupancy rate is 80%. In that case, your RevPAR is $200
For instance, if your RevPAR is $150 while a competitor’s is $220, it indicates lower revenue generation per room, even if your occupancy rate is high.
Total Revenue per Available Room or TRevPAR measures your property’s revenue against total available rooms in your hotel. While RevPAR only considers room revenue, this hotel performance metric includes all your revenue streams, like food and beverage, spa services, and conference and banquet sales. That’s why you get a more holistic view of the hotel's financial performance.
TRevPAR = Total hotel revenue ÷ Number of available rooms
If your hotel earns $50,000 in total revenue from rooms, dining, and other services, and has 100 available rooms, your TRevPAR is $500.
For instance, let’s say your TRevPAR is $450, while a competitor’s is $600, but both your average room rate and occupancy rate are roughly the same. This means their rooms, along with additional services, are generating more revenue per available room. This points to opportunities to improve your dining, events, and other offerings to boost total earnings.
Average Length of Stay, or ALOS, measures the average number of nights guests stay at your hotel during a given period. It helps identify whether guests are booking short stays or extended visits, showing how your rooms are being occupied over time.
ALOS = Total room nights ÷ Total number of bookings
Suppose your hotel records 300 room nights from 100 bookings. Then, your ALOS is 3 nights.
For example, if your ALOS is 2 nights while a competitor’s is 4 nights, it shows guests at your hotel stay for shorter periods.
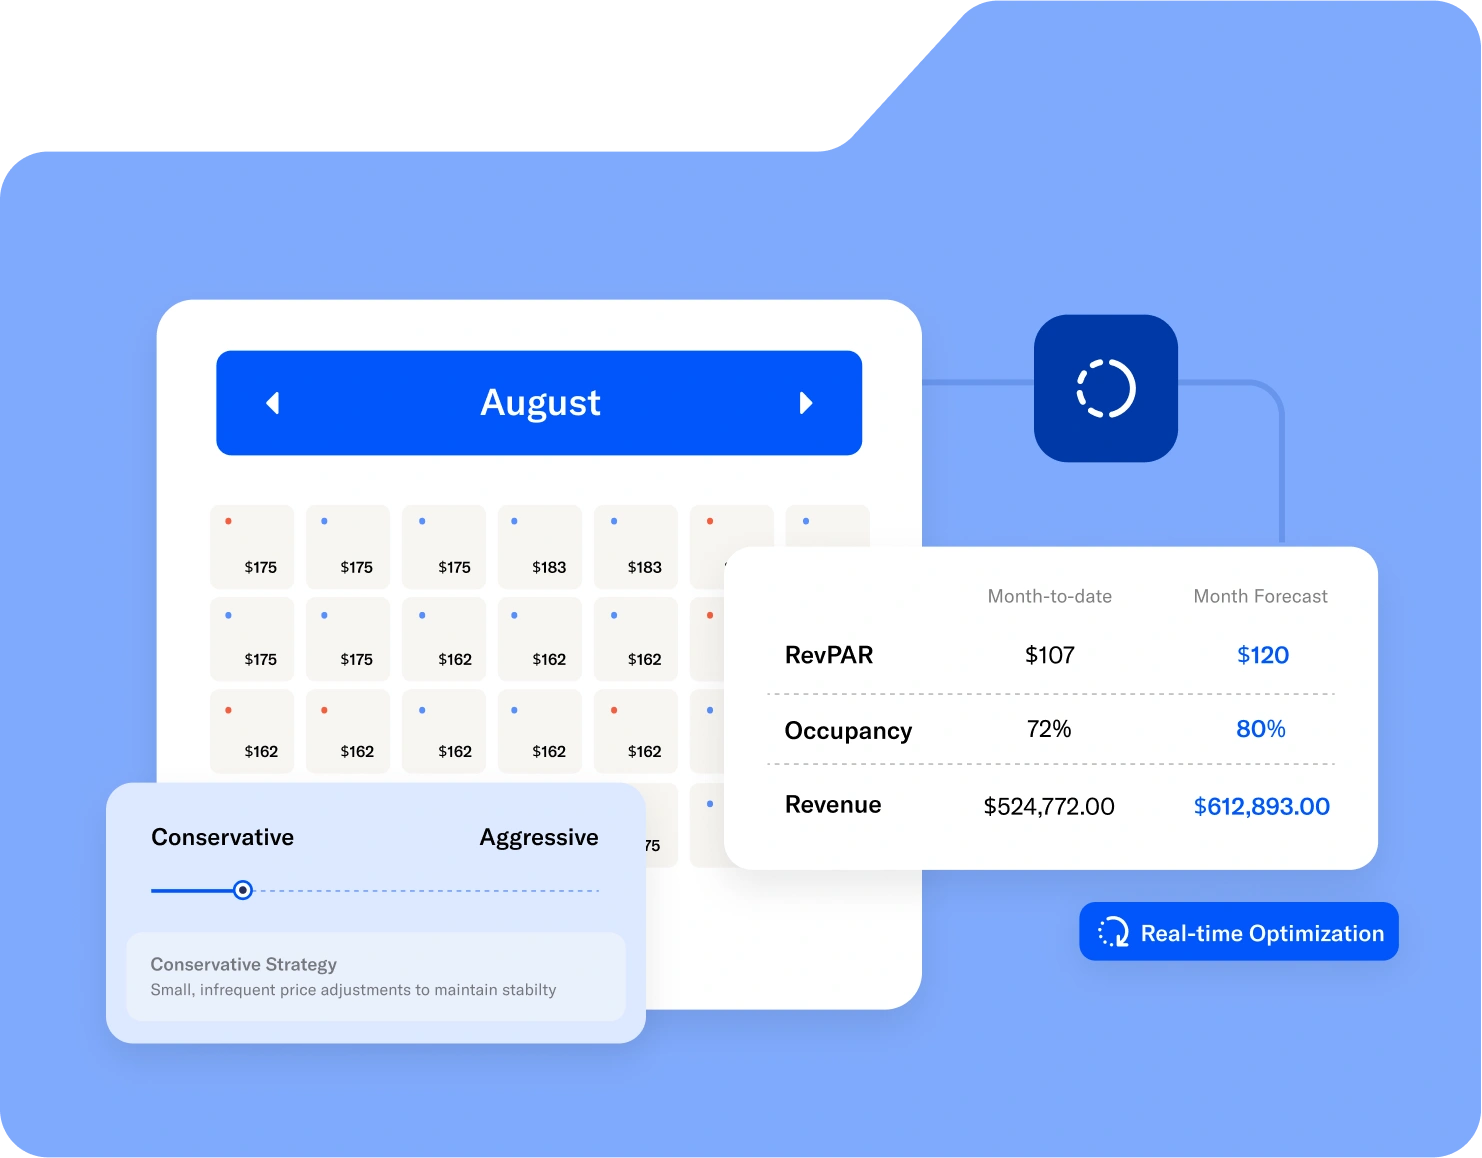
Now, tracking hotel metrics manually is time-consuming and error-prone. You must calculate these revenue metrics for each channel, while monitoring bookings, cancellations, and demand changes can be overwhelming. That’s a lot of work, but with roommaster Revenue Management, you can just automate it.
Powered by ampliphi, our platform connects to your PMS and tracks metrics like ADR, RevPAR, and others automatically. It also offers real-time dynamic pricing across channels and gives rate recommendations to protect ADR and RevPAR. No need to spend time crunching numbers manually.
Profitability metrics measure how much money a hotel actually keeps after covering all its costs. Unlike revenue metrics that focus on incoming money, these metrics reveal what contributes to the bottom line and what drains resources. But you must know which metrics matter most; otherwise, you will waste time running behind irrelevant hotel KPIs while the impactful insights sit unnoticed.
Here are the hotel profitability metrics you should track regularly:
GOPPAR measures the profit you generate per available room after deducting operating expenses from total revenue.
GOPPAR = (Total revenue − Operating expenses) ÷ Number of available rooms
For example, if your hotel earns $100,000 in total revenue, spends $60,000 on operating costs, and has 100 rooms available, GOPPAR = ($100,000 − $60,000) ÷ 100 = $400.
Suppose your total GOPPAR increases even when the hotel occupancy rate stays the same. This shows that your hotel is generating more profit per available room, indicating effective cost management and better pricing.
CPOR measures the direct cost of servicing each occupied room in your hotel. This number includes the expenses of housekeeping, utilities, and amenities.
CPOR = Total room operating costs ÷ Number of rooms sold
Let's say your operating costs are $15,000 for 100 rooms sold. Your CPOR will be $15,000 ÷ 100 = $150.
If CPOR rises while ADR stays the same, profit per room decreases. This shows that you must control costs.
Net profit margin measures the percentage of total revenue that you get as profit after all expenses, taxes, and fees.
Net profit margin = (Total profit ÷ Total revenue) × 100
For example, the net profit margin for a total revenue of $100,000 and a net profit of $25,000 will be: $25,000 ÷ $100,000 × 100 = 25%.
To make it simpler, suppose two hotels have similar revenue but different net profit margins. The higher-margin hotel is managing costs better and generating more real profit.
Revenue per employee measures the revenue each of your staff members generates over a specific period. It’s one of the most important hospitality industry KPIs, showing profitability and labor efficiency.
Revenue per employee = Total revenue ÷ Number of staff members
Let’s say your total revenue is $50,000 and the hotel has 25 staff. Your revenue per employee will be: $50,000 ÷ 25 = $2,000 per staff member.
A low revenue per employee compared to similar hotels indicates inefficient staffing or underperformance in revenue-generating departments.
Benchmarking against competitors helps you understand your hotel’s market performance and identify areas of improvement. Sure, tracking your own numbers is important. But without context, it’s hard to know if those seemingly impressive numbers actually work in a broader competitive scenario.
Comparing key metrics with similar properties reveals strengths, weaknesses, and opportunities, guiding pricing, marketing, and operational decisions. Here’s how to do it:
MPI measures your hotel’s occupancy against a set of competitors. It shows how much of the market demand your property captures.
Here is the formula: MPI = (Your hotel’s occupancy ÷ Competitor occupancy) × 100. That means, if your occupancy is 75% and the competitor's average is 60%, MPI = 75 ÷ 60 × 100 = 125.
You can use MPI to see whether your hotel is outperforming or underperforming in room occupancy. An MPI above 100 indicates strong market capture. But if you score below 100, it’s time to adjust pricing, services, and marketing efforts.
RGI compares your hotel’s RevPAR to the competitive set, showing how efficiently your property converts occupancy into revenue. The formula is: RGI = (Your hotel’s RevPAR ÷ Competitor RevPAR) X 100. Let’s say your RevPAR is $150 and the competitor's average is $200. Then your RGI will be 150 ÷ 200 × 100 = 75.
This hotel KPI measures your ADR against competitors, showing how your pricing aligns with the market. You can use this formula: ARI = (Your ADR ÷ Competitor ADR) X 100. This means that if your ADR is $180 and the competitor's ADR is $200, the ARI is 180 ÷ 200 × 100 = 90.
Once you calculate MPI, RGI, and ARI, analyze them together. A high MPI with a low RGI indicates you are filling rooms but not maximizing revenue. A low ARI may explain the RGI gap. Use these insights to refine pricing, campaigns, and operational decisions. If you keep at it consistently, your hotel’s market performance will improve.
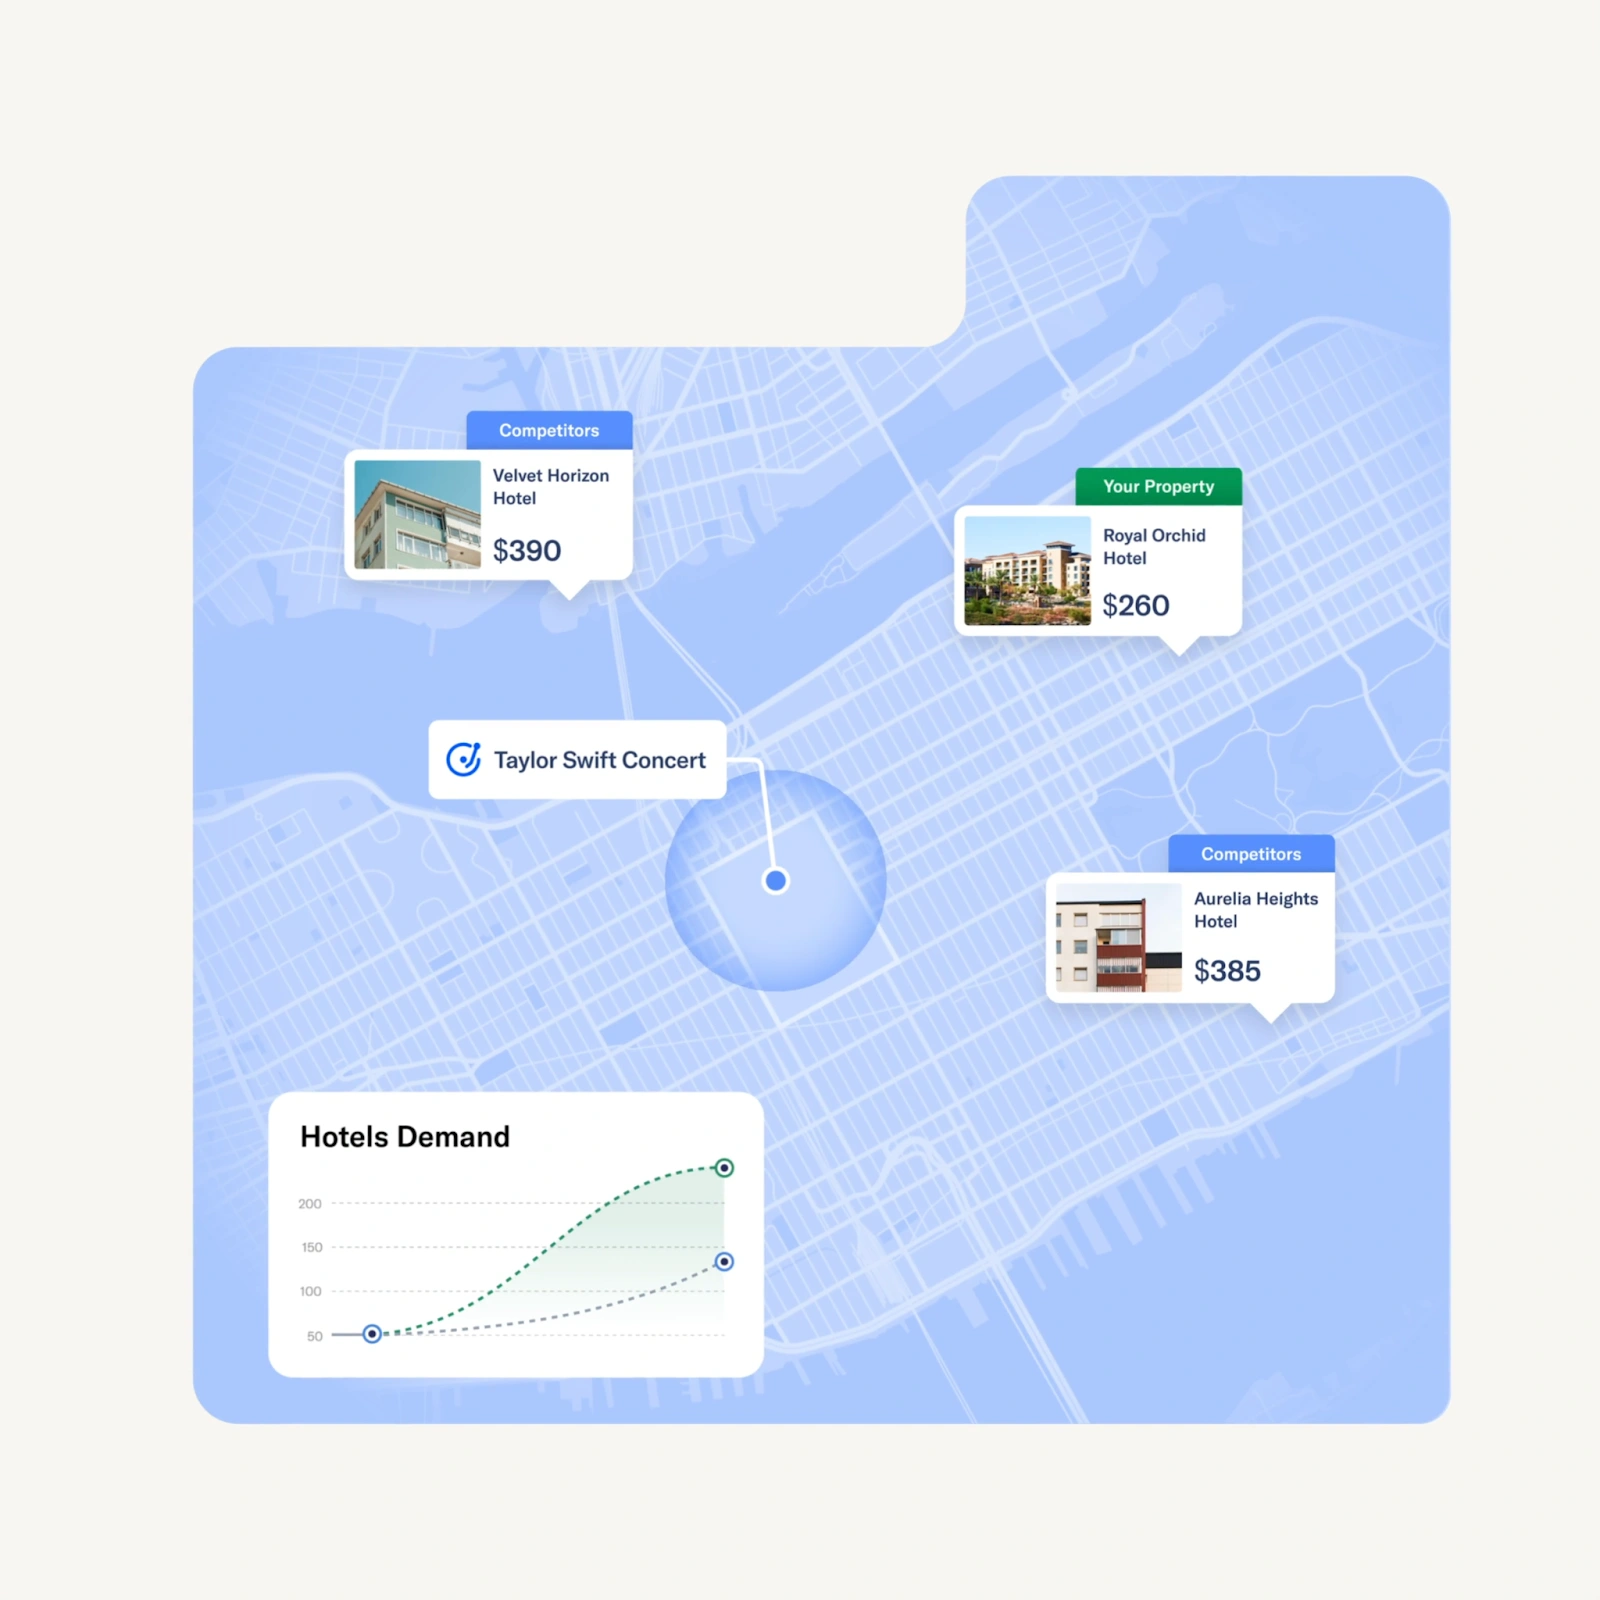
But again, doing these steps manually takes up a lot of time. And running a hotel scarcely leaves you with any time to spare. However, with roommaster, you can run constant competitor analysis automatically.
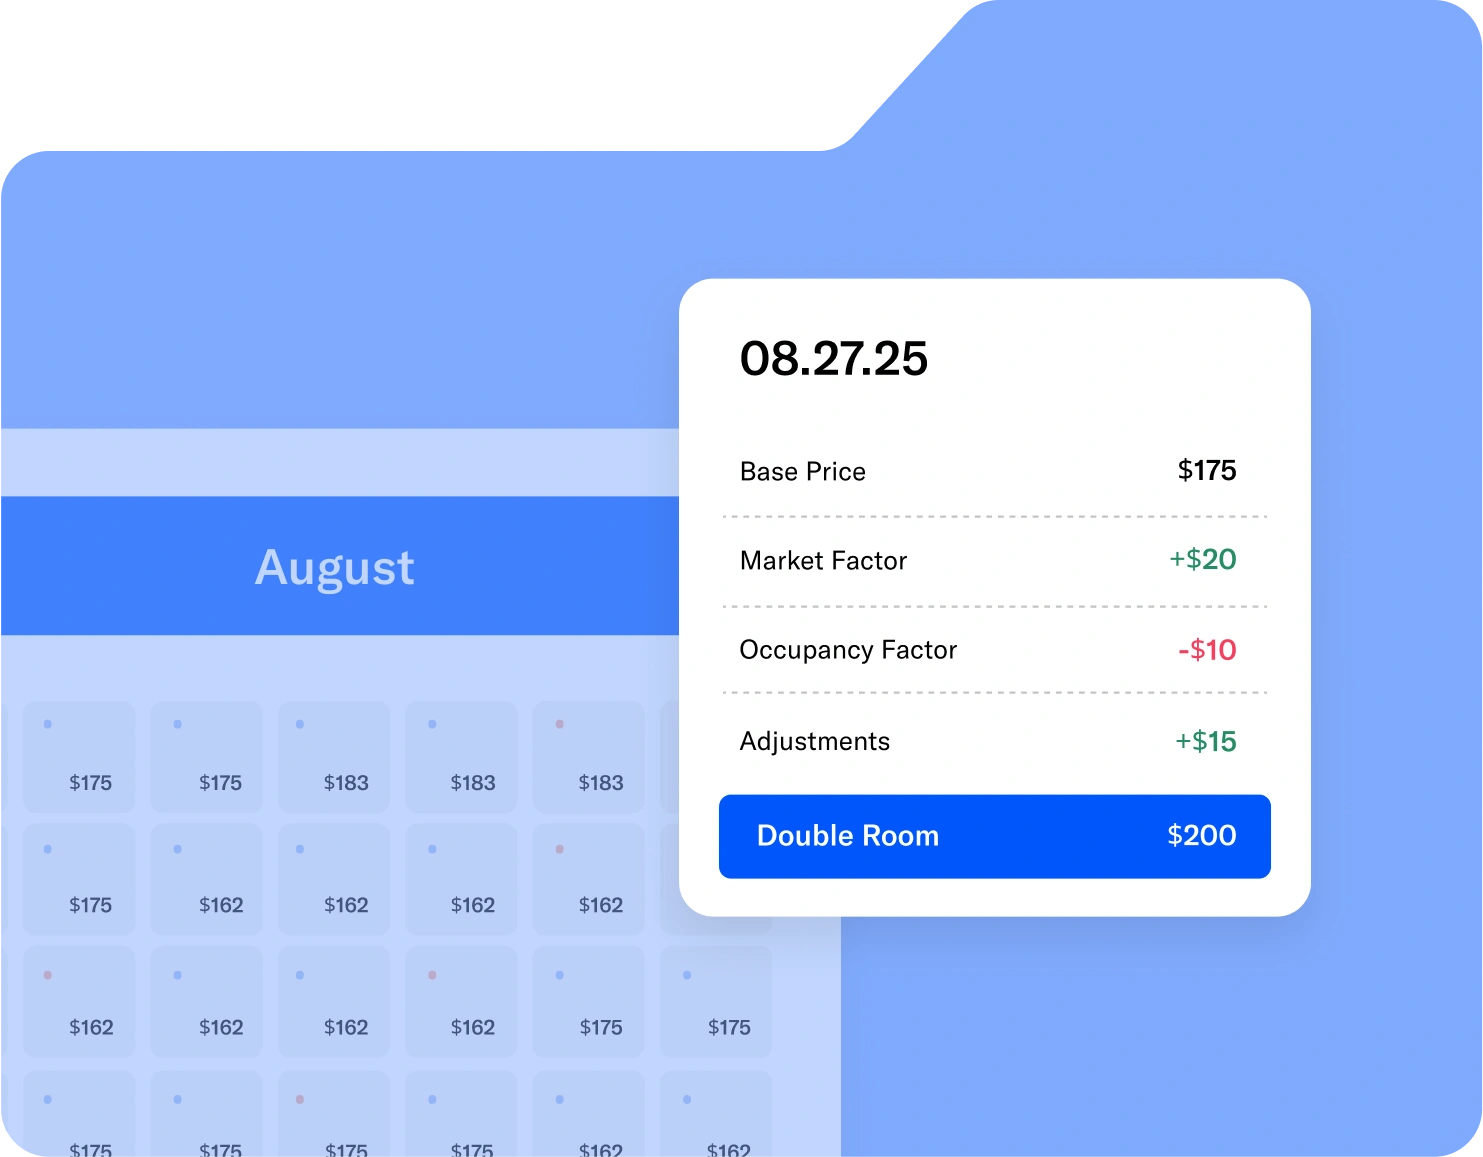
Powered by ampliphi, our AI-powered Hotel PMS monitors competitor pricing across your market. It automatically tracks rate changes and market positioning. This way, you never miss an optimum pricing opportunity.
The AI-powered system recommends dynamic pricing according to competitor data. The best part is that you can set pricing rules and just automate rate changes.
{{revenue-management-two}}

Marketing and distribution metrics measure how well your hotel attracts and converts guests across all your channels. Tracking them answers important marketing performance-related questions, like:
Here are some of the hotel KPIs for marketing and distribution you must track:
The conversion rate shows how many of your website visitors actually book a room or service at your hotel. It’s a quick way to tell if your site and marketing are doing their job or just bringing empty traffic.
Conversion rate = (Number of bookings ÷ Number of website visitors) X 100
For example, if 500 bookings come from 10,000 visitors, your conversion rate is 5%.
If traffic grows but conversion drops, it signals poor user experience, irrelevant targeting, or pricing mismatches.
Distribution cost percentage measures how much of your revenue goes toward commissions, listing fees, and other channel costs. It tells you whether your distribution strategy is profitable or too dependent on third parties.
Distribution cost percentage = (Total distribution costs ÷ Total room revenue) X 100
For instance, you spend $8,000 on OTA commissions and earn $40,000 in room revenue. In that case, your distribution cost is 20%.
High distribution costs can cut profits even when bookings rise, showing the need to strengthen direct sales.
The direct booking ratio measures the share of bookings made directly through your website, calls, and booking engine, rather than through OTAs. It’s a strong indicator of how well your marketing builds trust and repeat demand.
Direct booking ratio = (Direct bookings ÷ Total bookings) × 100
Suppose 300 out of 1,000 total bookings come from your website. Then, your direct booking ratio is 30%.
A higher ratio means stronger brand loyalty and better margins per booking
Customer acquisition cost shows how much you spend to attract each new guest. It helps you understand whether your marketing budget is being used efficiently or wasted on low-return and ineffective channels.
CAC = Total marketing spend ÷ Number of new customers acquired
Let’s say you spend $5,000 on ads and gain 250 new guests. Then, your CAC is $20.
If CAC keeps rising, you should refine your targeting and focus on repeat guests through loyalty offers.
Guest satisfaction metrics show how well a hotel meets guest expectations before, during, and after their stay. They detect patterns in service quality, staff performance, and overall guest experience. You can spot weak points in the guest journey and service early on, and address issues as soon as they arise. This builds stronger brand identity and loyalty, turning happy guests into repeat customers.
But is going through online reviews and occasional guest surveys enough? No. You must track these hotel KPIs to measure guest satisfaction and experiences:
Net Promoter Score measures how likely your guests are to recommend your hotel to others. It’s one of the simplest ways to gauge loyalty and overall satisfaction.
You can collect NPS through a single-question survey: “How likely are you to recommend our hotel to a friend or colleague?” Guests will respond on a scale of 0 to 10. Those who score 9–10 are Promoters, 7–8 are Passives, and 0–6 are Detractors. A higher score means more satisfied guests who are likely to return and spread positive word-of-mouth.
NPS = Percentage of promoters − Percentage of detractors
For example, if 60% of guests are promoters, 20% are detractors, and the rest are neutral, your NPS is 40.
A consistently high NPS means guests not only enjoyed their stay but are likely to return or recommend your hotel.
Guest satisfaction score captures overall guest feedback through post-stay surveys and review platforms. It reflects the average satisfaction level across all responses.
GSS = (Total satisfaction points ÷ Total responses) × 100
Let’s say your hotel scores 4.5 out of 5 on average from 200 guests. Then, your GSS is 90%.
A rising GSS often signals better staff performance and improved amenities, which directly impact repeat bookings.
Complaint resolution time tracks how long it takes your team to respond to and resolve guest issues. It reflects service efficiency and accountability.
Average resolution time = Total time to resolve complaints ÷ Number of complaints
For example, if 20 complaints take your team a total of 100 hours to resolve, your average time is 5 hours.
Faster resolution times usually lead to higher satisfaction and better long-term guest relationships.
Operational efficiency metrics track how well a hotel manages its day-to-day processes, costs, and staff performance. These hotel key performance indicators help spot waste, control expenses, and keep operations running smoothly without hurting guest experience. Here are the important KPIs you must measure:
The labor cost percentage shows how much of your total revenue goes into staffing. It helps balance staff expenses and maximize profits.
Labor cost percentage= (Total labor costs ÷ Total revenue) × 100
Let’s say you spend $25,000 on labor and earn $100,000 in revenue. Your labor cost percentage is 25%.
A sudden increase often signals inefficiency or low productivity.
This metric tracks how much energy expense each occupied room generates.
Energy cost per occupied room = Total energy cost ÷ Number of occupied rooms
Suppose your monthly energy costs are $10,000 and 2,000 rooms were occupied. In that case, your energy cost per room is $5.
High energy costs might point to equipment issues and outdated systems.
This shows how much is spent on upkeep for each available room.
Maintenance cost per room = Total maintenance costs ÷ Total rooms available
For example, if maintenance costs $15,000 for 300 rooms, that’s $50 per room.
Regularly tracking this hotel KPI keeps operations smooth and prevents costly breakdowns.
Understanding how to calculate hotel performance metrics is one thing. Doing it efficiently and accurately is another.
Here’s how you can calculate hotel performance metrics without spending too much time:
Benchmarking gives context to your performance metrics. It helps you see whether your hotel is doing well compared to similar properties in your market. While your exact targets will depend on location, season, and property type, here’s an average idea of what healthy benchmarks in the hotel industry look like:
Aim for an ADR that’s close to or slightly higher than your local market average. A higher ADR shows good pricing strategy and brand strength, but sudden jumps can hurt occupancy. Keep an eye on competitor rates and adjust gradually to stay competitive.
Most hotels target a 65–80% occupancy rate. Business and city hotels often go higher during peak seasons. Consistently high occupancy paired with stable ADR growth signals balanced demand management.
A RevPAR index above 100 is a good target to outperform your market peers. The goal is steady growth with both rate and occupancy, not one at the expense of the other.
For profitable hotels, it typically sits around 40–50% of total revenue. Strong GOPPAR reflects healthy margins and efficient cost control, even during low-demand periods.
Midscale hotels usually see 10 to 20% profit margins, while luxury and resort properties can reach 25 to 40%. Sustaining profitability within these ranges indicates smart expense management and solid pricing.
An NPS of 40 or higher is considered great in the hospitality industry. Anything above 50 signals excellent guest loyalty, while scores below 20 suggest you must fix service issues fast.
Keep labor costs between 25 to 35% of total revenue. This balance maintains service quality without overspending. Full-service hotels might sit slightly higher due to staffing needs.
You can only go so far with manual hotel KPI tracking. It’s messy, slow, and often inaccurate. Since you are putting so much effort into improving your hotel operations, why not do it right with the right technology?
Property management systems like roommaster give you a clear view of every key performance indicator, from occupancy and RevPAR to profit margins and distribution costs. The system automatically calculates metrics using live data from your bookings, POS, and accounting tools.
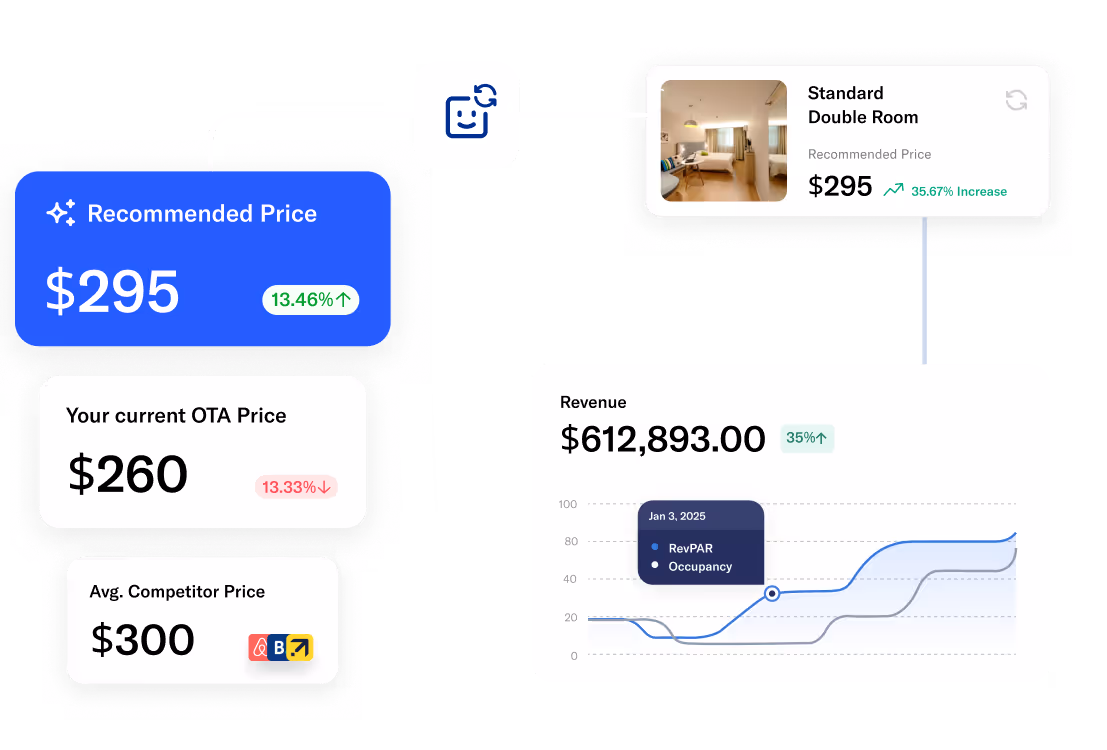
Powered by ampliphi, roommaster continuously monitors booking data, historical patterns, forward availability, competitor data, and even cancellation trends. This integration analyzes your hotel’s past performance, anticipates future demand, and offers rate recommendations to protect your ADR and RevPAR. That’s why hotels using roommaster report a 35% surge in RevPAR and 40% higher ADR while boosting hotel occupancy rate.
Based on the analysis, our system recommends the best pricing for your hotel rooms. You can approve them manually or automate dynamic pricing. The update goes straight into your roommaster channel manager, booking engine, and PMS, keeping rates consistent across every channel. You never have to worry about duplicate or incorrect data. Plus, the AI-powered system continuously learns from your hotel performance metrics and suggests better pricing strategies over time!
“We use all kinds of reports to compare from this time to last year. You can pull future availability, future sales, being on the cloud I would say it has cut our workload like in half. I would definitely recommend roommaster.”
When tracked consistently, hotel performance metrics show a clear picture of your hotel’s financial health, guest satisfaction, and operational performance. However, the real advantage comes from connecting the dots, linking revenue performance, guest experience, and cost control to make better business decisions every single day.
roommaster simplifies hotel KPI tracking by pulling data from bookings, accounting, and POS into one intelligent dashboard. The system interprets them in real time, recommends rate changes, and automates updates across all channels. From RevPAR to occupancy rate, you see the full story of your hotel’s performance without digging through reports. With roommaster, you move from reactive damage control to proactive growth, turning every metric into a smart step toward higher revenue and better guest experiences.
Book a demo today and track every important hotel performance metric easily!
ADR (Average Daily Rate) is the average income earned per occupied room, while RevPAR (Revenue Per Available Room) measures revenue across all rooms, whether sold or not. RevPAR gives a fuller picture of hotel performance because it combines both occupancy and room rate data.
Common mistakes include tracking metrics in isolation, relying on outdated reports, ignoring competitor benchmarks, and not accounting for seasonality. Using an integrated system like roommaster helps avoid these errors by consolidating real-time data across all KPIs.
A good RevPAR depends on the market, location, and property type. However, a hotel should aim for steady growth month over month. Comparing RevPAR with competitors through tools like roommaster’s ampliphi integration helps you gauge real performance in your market.
Hotels should track performance metrics daily for revenue-related data and weekly or monthly for profitability and guest satisfaction. roommaster automates this tracking, providing live dashboards that update key numbers like occupancy, ADR, and RevPAR in real time.
GOPPAR (Gross Operating Profit Per Available Room) shows how much profit each room generates after operating expenses. It’s crucial because it reflects true financial performance, not just revenue. A higher GOPPAR means better cost control and operational efficiency.
These competitive indexes measure your hotel’s performance against competitors.
TRevPAR (Total Revenue Per Available Room) includes all revenue sources, including rooms, dining, spa, and other services, whereas RevPAR focuses only on room revenue. TRevPAR gives a more complete view of total income per room available.
{{cta-strip}}
The transition to roommaster is straightforward and efficient. Our implementation team handles data migration including reservations, guest profiles, and historical information.
See how roommaster's unified platform can work for your property. Our team will walk you through features tailored to your specific needs and operations.