Table of Contents
Join Thousands of Hotels Thriving with roommaster
The transition to roommaster is straightforward and efficient. Our implementation team handles data migration including reservations, guest profiles, and historical information.

The hotel occupancy rate shows the percentage of guest rooms hotels sell. You calculate it by dividing the number of occupied rooms by the total number of rooms, then multiplying by 100.
In 2025, Indian hotels achieved 70% occupancy, reflecting strong market demand. Major cities often exceed 80% occupancy, boosting room revenue and gross operating profit. Hotels improve performance through revenue management, smart pricing and marketing strategies. Collaborations with local businesses also attract more guests.
In this article, we explore how to increase hotel occupancy rates and use actionable insights to maximize profits.

A hotel’s occupancy rate shows how many rooms are occupied compared to the total number of rooms. For example, if your hotel has 100 rooms and 75 are booked, your room occupancy reaches 75%. Hotels express this figure as a percentage to clearly measure performance.
High occupancy rates indicate strong demand and smooth daily operations. Low rates suggest the hotel needs to improve sales strategies or marketing efforts.
When a hotel manager monitors this metric regularly, they meet desired occupancy levels. Plus, tracking trends allows managers to adjust room rates, optimize revenue per available room (RevPAR), and effectively match customer demand.
To find your hotel occupancy rate, divide the number of rooms occupied by the total number of rooms. Then, multiply the result by 100 to express it as a percentage. The hotel occupancy rate formula looks like this:
Occupancy rate = (Occupied rooms/ Total rooms) × 100
For example, if your hotel has 50 rooms and 35 are occupied, your occupancy rate equals 70%. This rate represents a solid benchmark for most hotels.
Many hoteliers wonder what a good occupancy rate is for a hotel. While 100% may seem ideal, it does not always maximize profits.
Occupancy rates fluctuate throughout the year due to seasonality and the hotel's location. Industry data shows the average hotel occupancy rate typically ranges between 70% and 95%. The optimal rate depends on your hotel's size, type, location, and target guests.
Interesting read: Occupancy Rate Calculator Explained
To understand different performance levels and optimize a hotel's revenue, hoteliers track rates by timeframe:
These different occupancy rates help hoteliers understand customer behavior and adjust strategies for specific market segments. Monitoring each timeframe signals higher guest satisfaction and maximizes the use of every available room.
To monitor hotel performance effectively, managers track key metrics that impact financial health and revenue growth. Here are a few of the most relevant ones:
Revenue per available room, commonly known as RevPAR, measures how much revenue each room generates, regardless of whether it is occupied. RevPAR helps hoteliers evaluate pricing decisions and understand how well rates convert demand into revenue.
Here’s how to calculate it:
RevPAR = Room Revenue ÷ Total Number of Rooms
For example, if a hotel earns $9,000 from 100 rooms, its RevPAR is,
RevPAR = $9,000 ÷ 100 = $90
A hotel with lower occupancy but higher RevPAR may outperform a fully booked property with discounted rates.
Average daily rate, or ADR, measures the average revenue earned per occupied room. This KPI helps hoteliers evaluate pricing effectiveness and understand how well room rates perform across different seasons and market conditions.
Here’s how to calculate it:
ADR = Room Revenue ÷ Rooms Sold
For example, if a hotel earns $7,500 from 75 occupied rooms,
ADR = $7,500 ÷ 75 = $100
A rising ADR often reflects stronger demand or improved rate discipline.

Repeat guest rate highlights how successfully a hotel builds loyalty. A higher percentage of repeat guests often indicates positive guest experiences and reduces reliance on costly acquisition channels.
You can calculate it as:
Repeat Guest Rate = Repeat Guests ÷ Total Guests × 100
For example, if 40 out of 200 guests return,
Repeat Guest Rate = 40 ÷ 200 × 100 = 20%
It proves especially valuable for hotels that focus on long-term relationships rather than one-time stays.
{{guest-app}}
Distribution channel performance evaluates how different booking channels contribute to room sales and revenue. This KPI helps hoteliers understand which channels deliver the highest value guests rather than just volume.
To assess performance, hotels compare room nights, revenue, and costs across channels.
For example, direct bookings may deliver fewer reservations but higher profit margins than third-party platforms.
Analyzing channel performance allows hotels to refine their distribution strategy and invest in channels that support sustainable revenue growth.
Also read: Calculators To Optimize Your Revenue & Management
Several factors shape hotel performance, but certain elements influence demand more strongly. Hoteliers who understand these drivers can consistently increase occupancy, improve planning, and increase revenue.
Hotels near major attractions, business hubs, or transport centres often see strong bookings during key events. For example, New Orleans hotels reached occupancy around 86% during Mardi Gras and nearly 97% in central districts during major game weekends, driving high room rates and guest spend.
Properties near large festivals or conferences often experience surges in demand, with direct effects on occupancy and pricing power that outperform those in quieter markets.
Market demand can swing sharply with seasons, holidays, and school breaks, pushing occupancy higher during hot travel periods. In India, seasonal demand and business travel helped several key markets exceed 80% occupancy at in 2024 end, with average rates rising across cities like Mumbai and Kochi.
Hotels that plan for slower periods with targeted offers and value can mitigate seasonal troughs.
Pricing decisions often influence volume and rate quality simultaneously. In the U.S., industry data showed occupancy of about 59.1% in early 2025 (a rise of 0.5% from February 2024) accompanied by a moderate increase in ADR to about $159.39 (up by 1.4%), reflecting pricing resilience even with soft demand.
Hotels that calibrate prices to market conditions and demand patterns often hold a competitive edge in both occupancy and revenue.

Promotional efforts from surrounding properties frequently reshape guest choices. If nearby hotels launch aggressive promotions or innovative packages, travellers may shift accordingly.
Hotels that monitor competitors can adjust marketing efforts and rate offers to reclaim share.
Guest reviews and visibility across booking channels affect consumer trust and conversion rates.
Positive reviews paired with strong placement on online platforms often convert browsers into bookings, helping hotels fill rooms that might otherwise sit empty.
Business travel can greatly influence occupancy. Industry forecasts indicate that business travel often supports hotel performance outside peak leisure periods, helping sustain occupancy year-round.
A strong occupancy strategy helps hotels attract more guests, stabilize revenue, and outperform local competition in today’s dynamic environment. Since occupancy remains an important metric, hotels must use smart systems that support demand, operations, and the guest experience.
As a modern, fully upgraded, cloud-based property management system (PMS), roommaster PMS
Revenue decisions directly influence demand, pricing confidence, and the ability to reach a good occupancy rate. Smart automation helps hotels respond faster to market shifts and to changes in guest booking behavior.
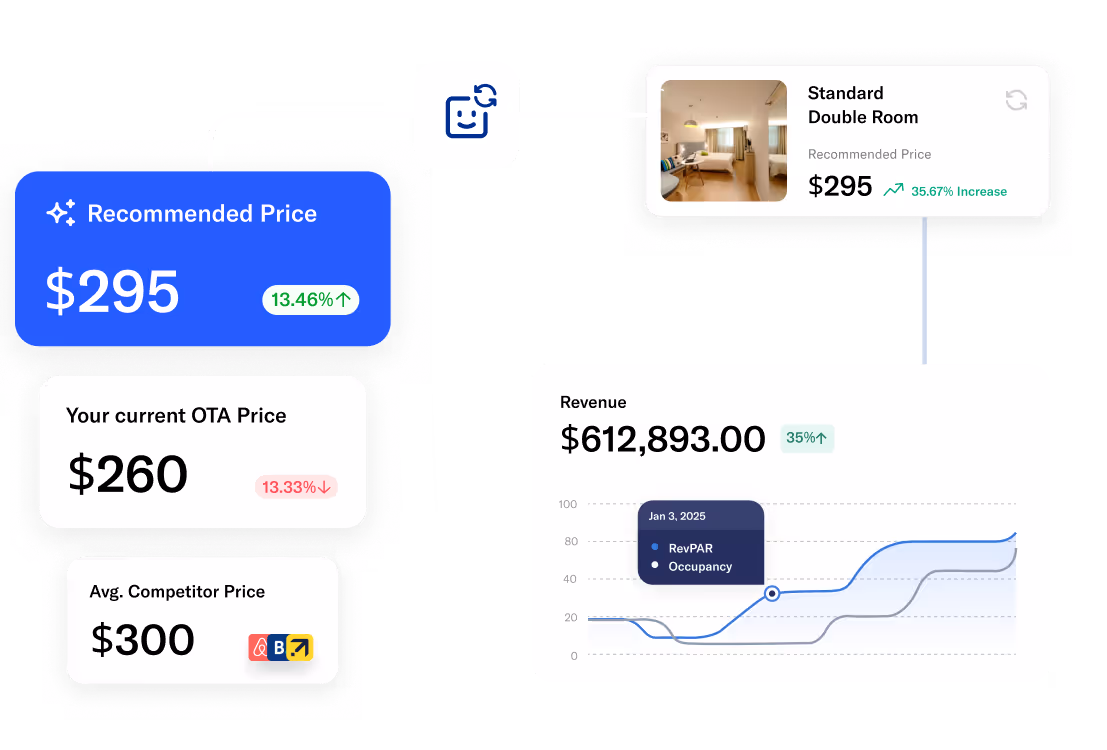
roommaster Revenue Optimization uses AI to adjust rates dynamically based on demand signals. Built by hoteliers, for hoteliers, this suite reflects real operational needs. The platform aligns pricing with seasonality, events, and historical performance.
Revenue managers save 4 to 6 hours weekly through automation. Unified analytics help teams protect margins without relying on constant offering discounts. These insights help smaller properties compete confidently during both low- and busy-season periods.
The best part is that roommaster PMS integrates seamlessly with the ampliphi RMS. Its Auto Pilot feature automatically adjusts rates using real-time demand data, allowing teams to stay focused on daily operations while pricing is optimized in the background. Hotels using roommaster RMS report up to 35% higher RevPAR, a 40% increase in ADR, and savings of nearly 29 hours per month per revenue manager.
{{revenue-management-one}}
💡 Pro Tip: Boost your hotel’s efficiency and revenue with The 90-Day Hotel Revenue Acceleration Playbook. This step-by-step guide shows independent properties how to leverage roommaster’s management platform alongside ampliphi’s AI-driven revenue optimization to reduce manual tracking, cut training time, and improve RevPAR.
Trusted by over 5,500 clients worldwide, the playbook empowers hoteliers to make data-driven decisions, enhance guest satisfaction, and achieve sustainable revenue growth.
Distribution strength determines visibility, reach, and booking efficiency across traveler touchpoints. Hotels need synchronized channels to capture demand during peak and holiday season travel.
roommaster Marketing and Distribution Suite centralizes channel control within one unified platform. The Channel Manager syncs rates and availability across all major booking channels. One login eliminates manual updates and reduces the risk of overbooking.
Meanwhile, the Booking Engine drives direct reservations and improves conversion performance. Hotels often achieve 15-30% shifts toward direct bookings. These tools help increase demand without adding operational complexity.
Repeat guests support stability, profitability, and long-term occupancy growth. Personal service helps hotels attract loyalty beyond price competition.
roommaster Guest Experience Suite stores preferences, stay history, and communication records centrally. Here’s how:
These experiences improve satisfaction and consistently increase occupancy rates across seasons.
Modern travelers value control, speed, and convenience throughout every stage of their stay. Mobile tools help hotels meet expectations while easing staff workloads.
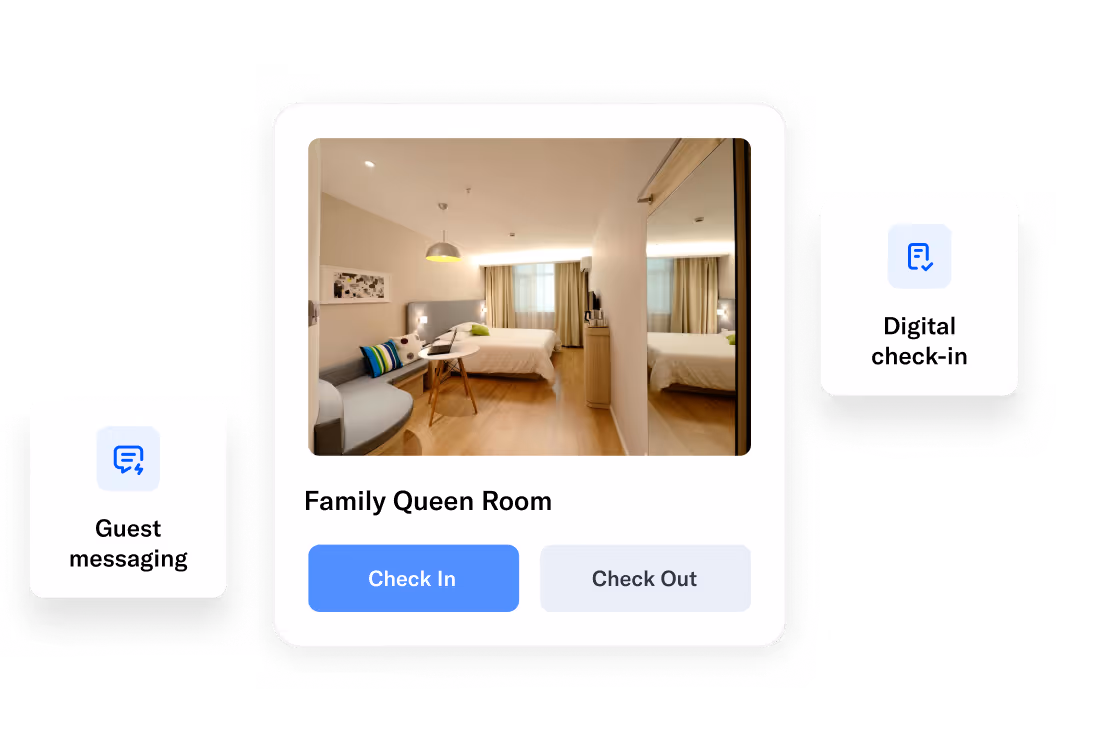
roommaster Hotel Guest App supports digital check-in, check-out, and mobile guest profiles. Guests manage stays directly from personal devices or tablets. The system reduces front desk congestion during peak arrival windows. As a result, staff gain time for service quality and relationship building.
This convenience encourages positive reviews and attracts more guests during high-demand periods.
Clean, ready rooms directly affect occupancy potential and same-day revenue opportunities. Operational visibility helps hotels turn rooms faster and avoid lost demand.
roommaster Housekeeping Management provides real-time room status updates across departments. Here’s how this happens:
These efficiencies help hotels maximize available inventory and maintain a strong occupancy rate important for profitability.

Across modern hotels, AI virtual concierges resolve routine guest inquiries faster than staff. In fact, virtual systems handle up to 67% of customer questions autonomously and increase booking conversions by up to 35% compared to properties without instant response capabilities. roommaster Concierge brings these benefits directly to your property, combining AI efficiency with seamless PMS integration.
The platform ensures no missed calls or lost bookings. Guests receive five-star service 24/7, supporting satisfaction and repeat stays. Here’s how:
Suggested read: Hotel Rack Rate Explained: What Is It And Everything You Need To Know
Hoteliers often misinterpret occupancy numbers and make avoidable calculation mistakes. These include:
Hotels that calculate occupancy accurately spot opportunities that others often miss. Avoiding common mistakes lets managers react to demand and capture every revenue chance. Plus, tracking group blocks, cancellations, and market trends gives teams an edge over local competition.
roommaster PMS helps hotels act on these opportunities by unifying operations, pricing, revenue optimization, and guest management on a single platform. Wood River Inn, a 57-room independent property, improved efficiency without losing identity. Owner Ryan Allison implemented roommaster RMS and cut administrative tasks immediately. The unified platform connected all channels and let his team focus on selling rooms instead of switching systems.
What made the biggest difference was the ability to adjust rates remotely and respond instantly to demand. That flexibility allowed Ryan to maintain complete control, regardless of his location.
Take control of your occupancy and revenue today with roommaster RMS—Request a demo now!
A good hotel occupancy rate usually ranges between 70% and 95%, depending on property type, location, and season.
Hotels should calculate occupancy rates daily to track real-time demand trends. Weekly and monthly reviews help identify patterns, adjust pricing, and plan staffing. Additionally, frequent monitoring allows managers to react quickly to market shifts, events, or seasonal changes, optimizing revenue and maintaining strong room utilization.
Occupancy rate measures the percentage of rooms sold, while RevPAR calculates revenue per available room. RevPAR combines occupancy and ADR to show how effectively a hotel generates revenue, offering a clearer view of profitability beyond simple room utilization metrics.
Occupancy rate can exceed 100% if a hotel sells more rooms than its standard inventory through overbooking, shared accommodations, or temporary expansions. While rare, this situation typically occurs during peak seasons or high-demand events to maximize revenue and avoid turning away guests.
To calculate occupancy for multiple properties, add all occupied rooms across properties, divide by total available rooms across properties, then multiply by 100. The hotel occupancy rate formula looks like this:
Occupancy rate = (Occupied rooms/ Total rooms) × 100
This provides a portfolio-level occupancy rate, helping management evaluate overall performance and identify which properties require pricing or marketing adjustments.
Low occupancy can result from poor location, weak marketing, high competition, incorrect pricing, low guest satisfaction, or off-peak seasonality.
Higher occupancy generally increases revenue by selling more rooms, but profitability also depends on ADR and operational efficiency. Low occupancy reduces revenue potential and increases per-room costs, so hotels must balance occupancy with pricing strategies to maximize profits while maintaining guest satisfaction.
Hotels achieve maximum profitability by balancing occupancy and ADR. High occupancy with low ADR can affect revenue, while high ADR with low occupancy wastes inventory. To make this possible, managers should optimize pricing to maintain healthy occupancy while achieving strong average daily rates that maximize RevPAR.
{{cta-strip}}
The transition to roommaster is straightforward and efficient. Our implementation team handles data migration including reservations, guest profiles, and historical information.
See how roommaster's unified platform can work for your property. Our team will walk you through features tailored to your specific needs and operations.