Data analytics in the hospitality industry, in brief
Data analytics in the hospitality industry is the practice of collecting, organizing, and interpreting the data a hotel already generates, such as reservations, rates, folios, and guest reviews, so managers can make pricing, marketing, and operations decisions from evidence rather than instinct. Because most of that data already sits in your property management system, an independent hotel usually starts by reading it well, not by buying more software.
{{pms-one}}
What is data analytics in the hospitality industry?
Data analytics in the hospitality industry refers to the methods hotels use to interpret operational and guest data and act on it. It generally follows four types, each answering a different question and building on the one before it.
| Analytics type |
Question it answers |
Example for a hotel |
| Descriptive |
What happened? |
Last month ran 68% occupancy at a $180 ADR |
| Diagnostic |
Why did it happen? |
A three-night OTA outage cut midweek pickup |
| Predictive |
What is likely next? |
A local event points to a demand spike in six weeks |
| Prescriptive |
What should we do? |
Raise rate for those dates and cap OTA allotment |
Most independent hotels live in the descriptive column, reading last night's numbers. The value grows as you move right, because diagnostic work explains a soft week and predictive work lets you price for demand before it arrives. For a broader view of the discipline, see our guide to hotel data analytics.
How do hotels use data analytics to increase revenue?
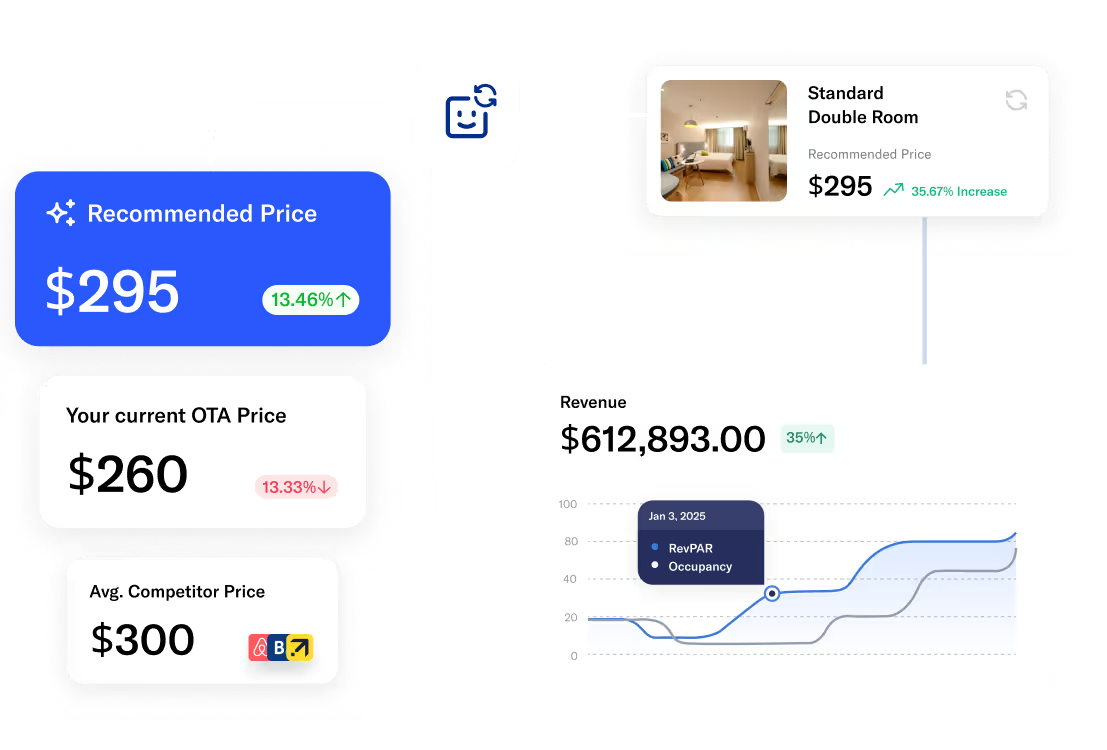
Hotels use data analytics to price against real demand instead of a fixed seasonal rate sheet. When you can see booking pace, channel mix, and length of stay together, you can raise rates into demand, protect your best dates from cheap OTA inventory, and shift spend toward the segments that actually book.
Three levers matter most for a smaller property:
- Dynamic pricing: move rates with demand signals rather than holding one rate all season, which is the core of revenue management.
- Channel decisions: compare the true cost of each source, since a direct booking usually nets more than the same night sold through a high-commission OTA fed by your channel manager.
- Demand forecasting: use history plus events to plan rate and staffing ahead of time, covered in our note on demand forecasting.
The goal is not more dashboards. It is a small number of decisions, made earlier and with evidence.
{{revenue-management-one}}
Which hotel metrics and KPIs should you track?
Track occupancy, ADR, RevPAR, and GOPPAR, and always read them together, because any single one can mislead. High occupancy earned by discounting can still lower RevPAR, while a strong ADR at thin occupancy leaves rooms empty.
- Occupancy: rooms sold divided by rooms available, the demand signal.
- ADR: average daily rate, the price signal.
- RevPAR: revenue per available room, occupancy multiplied by ADR, the combined signal.
- GOPPAR: gross operating profit per available room, which folds in cost.
This page keeps the KPI list short on purpose. For the full breakdown of formulas and benchmarks, use our deep dive on hotel performance metrics, and try the numbers in the RevPAR calculator.
A worked example: a 40-room boutique reads its pace report
Consider a 40-room boutique running 68% occupancy at a $180 ADR. RevPAR is 180 multiplied by 0.68, or $122.40, so daily room revenue is about $4,896.
Six weeks out, the pace report shows next month tracking six room-nights per day behind where last year sat at the same point. Instead of holding rate and hoping, the manager releases a direct-booking offer and trims ADR to $172. Occupancy recovers to 74%, so RevPAR becomes 172 multiplied by 0.74, or $127.28, and daily revenue rises to about $5,091. That is roughly $195 more per night, near $5,850 across the month, from reading one report early.
Ready to see this in your own numbers? Book a demo and we will walk through your reports with you.
What is predictive analytics in hospitality?
Predictive analytics in hospitality uses historical booking data, seasonality, and external signals such as local events to estimate what demand will look like before it arrives. In practice it usually shows up as pace and pickup reports, which compare how a future date is filling now against the same lead time last year.
Pace tells you the trend, and pickup tells you the recent change. Together they turn a vague sense that "next month feels slow" into a dated, quantified gap you can price against. For an independent hotel, this is the highest-impact step beyond simple reporting, because it moves a rate decision from reactive to planned.
How does guest segmentation improve marketing?
Guest segmentation improves marketing by grouping guests by behavior, such as booking channel, stay purpose, spend, or repeat frequency, so you spend on the people most likely to book direct again. A single offer sent to everyone wastes budget, while a targeted note to past direct guests tends to convert better and costs less.
Segmentation also feeds customer lifetime value, the total a guest is worth across repeat stays and on-property spend. Ranking guests by lifetime value, not just last-stay revenue, tells you which segments deserve a loyalty rate or a personal follow-up. Review sentiment adds the qualitative half, and our note on guest feedback analysis covers how to read it.
What data sources feed hotel analytics?
The data a hotel needs is usually already there, spread across the systems you run every day. The table below maps common sources to the insight they give and the action they support.
| Data source |
Insight it gives |
Action it supports |
| PMS reservations and folios |
Occupancy, ADR, length of stay |
Rate and inventory decisions |
| Channel manager and OTAs |
Channel mix and commission cost |
Shift toward direct bookings |
| CRM and guest profiles |
Segments and repeat behavior |
Targeted, lower-cost marketing |
| Review platforms |
Sentiment and service gaps |
Operational fixes and training |
| Market and compset data (STR) |
Position against local competitors |
Benchmark rate and share |
Your property management system is the anchor because it holds the transaction record every other source connects to. Market benchmarking from a provider such as STR adds the outside view, showing whether a strong month was your work or just a strong market.
What are the benefits of real-time reporting?
Real-time reporting means the numbers update as bookings, check-ins, and payments happen, so the front desk and the owner see the same current picture instead of a spreadsheet rebuilt each morning. The benefit is speed: a rate response to a sudden pickup surge is only useful while the dates are still open.
Real-time dashboards also cut the manual work of stitching reports together by hand, which is where errors creep in. A single live view of occupancy, pace, and revenue supports faster decisions, and dedicated hotel reporting software or business intelligence software can layer trends on top of it.
What challenges do hotels face with data analytics?
The most common challenge is data silos, where reservations, reviews, accounting, and marketing each live in a separate tool that never share a view. When the numbers do not agree, staff stop trusting them, and analytics stalls before it starts.
- Data silos: disconnected systems with no single source of truth, the top blocker for independents.
- Data hygiene: duplicate guest profiles and inconsistent rate codes that quietly distort every report.
- Skills and time: small teams without a dedicated analyst, which is why built-in reporting beats a separate data project.
- Privacy: guest data must be handled under the rules that apply in your market.
The fix is rarely a big platform. It is consolidating the data you already have into one trustworthy view, usually inside the PMS that already records most of it.
How do you start using analytics as an independent hotel?
Start small and sequence it. You do not need a data team to get value in the first month.
- Pick three KPIs: occupancy, ADR, and RevPAR, and read them daily from your PMS.
- Add one pace report: compare next month's pickup against last year at the same lead time.
- Consolidate sources: get reservations, channels, and reviews into one view to kill the silos.
- Act on one decision: make a single rate or channel move from the data, then measure it.
- Layer in forecasting: once the basics are habit, extend into predictive pace and segmentation.
Each step compounds, and none of them requires a rip-and-replace project. The properties that win with data are usually the ones that started with a handful of numbers and acted on them consistently.
See how roommaster puts reservations, rates, and reporting in one place.
{{cta-strip}}
FAQs
1. What is data analytics in the hospitality industry?
It is the practice of collecting and interpreting hotel data, such as reservations, rates, and reviews, to make evidence-based decisions on pricing, marketing, and operations rather than relying on instinct.
2. What are the four types of data analytics?
Descriptive (what happened), diagnostic (why it happened), predictive (what is likely next), and prescriptive (what to do about it). Most hotels start with descriptive reporting and add the others over time.
3. Do independent hotels need a data analyst?
Usually no. Most small properties get strong results from the reporting already inside their PMS. A dedicated analyst matters more for groups managing many properties and larger data volumes.
4. Which KPIs should a small hotel track first?
Occupancy, ADR, and RevPAR, read together. Occupancy shows demand, ADR shows price, and RevPAR combines both. GOPPAR adds cost once the basics are a habit.
5. What is the difference between predictive and prescriptive analytics?
Predictive analytics estimates what demand will do next, often through pace and pickup reports. Prescriptive analytics recommends the action to take, such as a specific rate change for the dates in question.
6. What is the biggest challenge with hotel data analytics?
Data silos. When reservations, reviews, and accounting live in separate tools, the numbers disagree and staff stop trusting them. Consolidating into one source of truth solves most of it.
7. How does data analytics increase hotel revenue?
By pricing against real demand instead of a fixed rate sheet, shifting bookings toward lower-cost direct channels, and forecasting demand early enough to adjust rate and inventory before dates fill.


.png)
.png)
.png)