Table of Contents
Join Thousands of Hotels Thriving with roommaster
The transition to roommaster is straightforward and efficient. Our implementation team handles data migration including reservations, guest profiles, and historical information.

RevPAR is usually the first number owners and operators check, and that makes sense. It combines occupancy and average daily rate into one clear figure, so you can quickly see how well you fill rooms and how much you earn from them. Because it adds both metrics, RevPAR gives you a fast snapshot of revenue performance across your available inventory.
Still, if you review an STR report for hotels or analyze an STR report hotel benchmark regularly, you already know RevPAR only tells part of the story. It shows revenue at a high level, but it does not explain why performance shifts or where you can improve.
Discover how to analyze a STAR report, track hotel performance metrics, and make smarter pricing and revenue decisions.

A STAR report is a standardized benchmarking report that compares a hotel’s operating performance against a selected group of competing properties and the broader market.
In the hospitality industry, hoteliers often call it the hotel STR report or just the STAR report.
It gathers data from thousands of hotels and turns it into clear, easy-to-read comparisons. The report aggregates hotel industry data from thousands of properties and transforms that information into clear performance comparisons. It functions as a diagnostic tool that shows how your hotel compares with similar hotels in a defined market segment.
STR stands for Smith Travel Research, a hotel analytics company founded in 1985. STR Inc. leads the way in hotel benchmarking and provides data on hotel occupancy, supply, demand, and market share worldwide.
For example, STR data showed that the average hotel occupancy in the US in March 2024 was 63.7%, with an average daily rate of US$159.79(+0.4%). Miami ranked first among the Top 25 markets in all three key performance metrics. Occupancy rose 2.3% to 83.5%, ADR slipped 0.6% to US$284.14, and RevPAR increased 1.6% to US$237.25.
Hotels use the Smith Travel Accommodations Report to see how they stack up against competitors. This benchmarking report gives clear insights that help hotels make smarter decisions and improve performance.

STR reports give you a clear picture of your hotel’s performance and show exactly where you stand compared to the competition. An STR report can help you:
📌Suggested read: Important KPIs For The Hospitality Industry - 2026
Many independent hotels think benchmarking only helps big chains, which can cost revenue.
Even small properties compete in fast-moving markets where business travelers, leisure demand, and events affect occupancy. Relying only on your own data makes it hard to see the full picture.
A STAR report helps boutique and independent hotels to:
Getting a STAR report for your hotel is simple. To obtain a STAR report, hotels must fill out an application and meet certain standards to qualify.
You’ll need to provide several key data points to STR, including occupancy rate, ADR (average daily rate), and total room revenue, and agree to submit your performance data regularly.
Follow these three steps:
Click “Request a Demo” on the homepage or under “Data Solutions” > “Performance Data.”
Fill in your basic information and your hotel’s details. STR will contact you with a demo and instructions to create your account.
Make sure to provide the required performance data to qualify for the STAR report.
After your account is set up, log in to your STR dashboard, select your plan, and start generating reports. STR pricing typically depends on the type of report, reporting frequency, and level of detail required.
A basic monthly STAR report comes at a modest subscription fee, while more detailed or high-frequency reports come at a higher cost.
You’ll get 18 months of historical data, including year-on-year, year-to-date, and rolling 3- and 12-month metrics. Reports cover key performance indicators and indexes to help you track your hotel’s performance, which we’ll cover next.

The three core KPIs in a hotel STAR report are Average Daily Rate (ADR), Occupancy Rate (Occ), and Revenue per Available Room (RevPAR).
Monitoring these KPIs will enable hotels to compare themselves with their competitors and identify areas for improvement.
ADR measures the average revenue your hotel generates per occupied room during a specific period of time.
Here’s how you can calculate ADR:
ADR = Total Room Revenue ÷ Total Rooms Sold
You can use ADR to forecast weekly, monthly, or seasonal performance and set achievable revenue goals. If past performance fell short, ADR helps identify where to adjust pricing strategies.
{{revenue-management-one}}
Occupancy measures the percentage of rooms your hotel fills at a given time. It is a top-level indicator of your property’s success.
To calculate occupancy:
Occ = (Total Rooms Occupied ÷ Total Rooms Available) × 100
A higher occupancy rate means more rooms are generating revenue, but it should be analyzed alongside ADR to see the full picture.
RevPAR combines ADR and occupancy to show how well your hotel generates revenue from available rooms.
Here’s the formula to calculate RevPAR:
RevPAR = ADR × Occupancy
An increasing RevPAR usually means higher ADR, higher occupancy, or both.
By analyzing these three KPIs, you can see:
Index numbers show how your hotel performs compared to your competitors. They cover key metrics like occupancy, ADR, and RevPAR.
An index above 100 means your hotel is outperforming the market. An index below 100 shows there is room to improve. You calculate the index by dividing your hotel’s KPI by the average of your competitive set and then multiplying by 100.
A STAR report is a way of presenting your hotel’s performance data in a tab format. Each tab of the report enables you to compare your hotel’s performance with that of your competitors as well as the industry as a whole.
Here’s what each tab of the report reveals and why it is important:
This tab gives a quick overview of your hotel’s key metrics for the current month, year-to-date, and rolling 3- and 12-month periods.
You can see how your occupancy, ADR, and RevPAR compare to your competitive set and track short-term trends.
The STAR Summary shows occupancy, ADR, and RevPAR side by side with your compset and other industry segments.
It helps you determine how your hotel is performing not only against your competitive set but also within the broader market over a period of time.
This tab compares your hotel to your selected competitive set over the past 18 months, year-to-date, and rolling periods. It highlights trends, seasonal patterns, and how your hotel stacks up against competitors.
You can also see index numbers to identify areas where you are outperforming or lagging.
The response report lists properties in your competitive set that have submitted data to STR over the past 24 months.
It shows which competitors are reporting and helps you confirm that your compset is accurate.
This tab breaks down occupancy, ADR, and RevPAR by business type: transient, group, or contract.
You can compare your hotel’s results to your compset and market averages for each segment. It also helps you spot trends between weekdays and weekends.
Segmentation Analysis provides detailed monthly metrics for transient, group, contract, and total business over the last 18 months.
It includes occupancy, ADR, RevPAR, index, and rankings to show how each segment contributes to overall performance.
This tab breaks down performance by day of the week for each business segment.
It shows which days generate the most revenue and occupancy, helping you plan staffing, promotions, and pricing strategies.
This tab tracks monthly revenue from rooms, food and beverage, and other sources over the past 18 months.
Comparing your hotel to your compset helps you see where additional revenue opportunities exist and how these streams change over time.
{{revenue-management-two}}
Daily Data shows occupancy, ADR, and RevPAR for every day of the month.
You can see which days contributed most to monthly performance and identify patterns tied to events, weekends, or special promotions.
This tab provides occupancy, ADR, and RevPAR by day of the week and separates weekdays from weekends.
You can compare performance to your compset and market averages, helping you spot opportunities for improvement and plan strategies for specific days.
There are three most important tabs in a hotel STAR report, which you need to focus on, including:

Analysing your STAR report properly gives you the insights to make smarter, data-driven decisions that improve your hotel’s performance, revenue, and guest experience. Independent hoteliers often struggle because their tools are fragmented and data is disconnected.
With a modern, fully-upgraded, cloud-based, all-in-one PMS like roommaster, you bring everything together on one unified platform, giving you full visibility and control so you can focus on improving your hotel instead of juggling systems.
Start by focusing on the core KPIs, including occupancy, ADR, and RevPAR. These metrics show how well your hotel is performing versus your competitors and provide a clear view of revenue health.
With roommaster PMS, you can track these metrics in real time, pull historical data, and see the results of every rate plan and room type in one place. This unified view eliminates guesswork and ensures your analysis is accurate.
Next, look at your hotel’s metrics alongside your competitive set. Indexed numbers make comparisons simple, wherein:
Once you know the numbers, dig into the details to understand why they look that way. Break down performance by weekdays vs weekends or by guest type, such as transient versus group. Compare your results to broader market averages to account for seasonality, trends, and economic conditions. Historical data reveals patterns over months and years.
With our reporting software, you can generate 270+ built-in reports or build custom analyses, uncovering untapped revenue opportunities and identifying operational efficiencies without switching between systems.
Use your analysis to highlight where your hotel excels, such as high RevPAR or strong ADR, and where there is room to improve, like lower occupancy or underperforming segments.
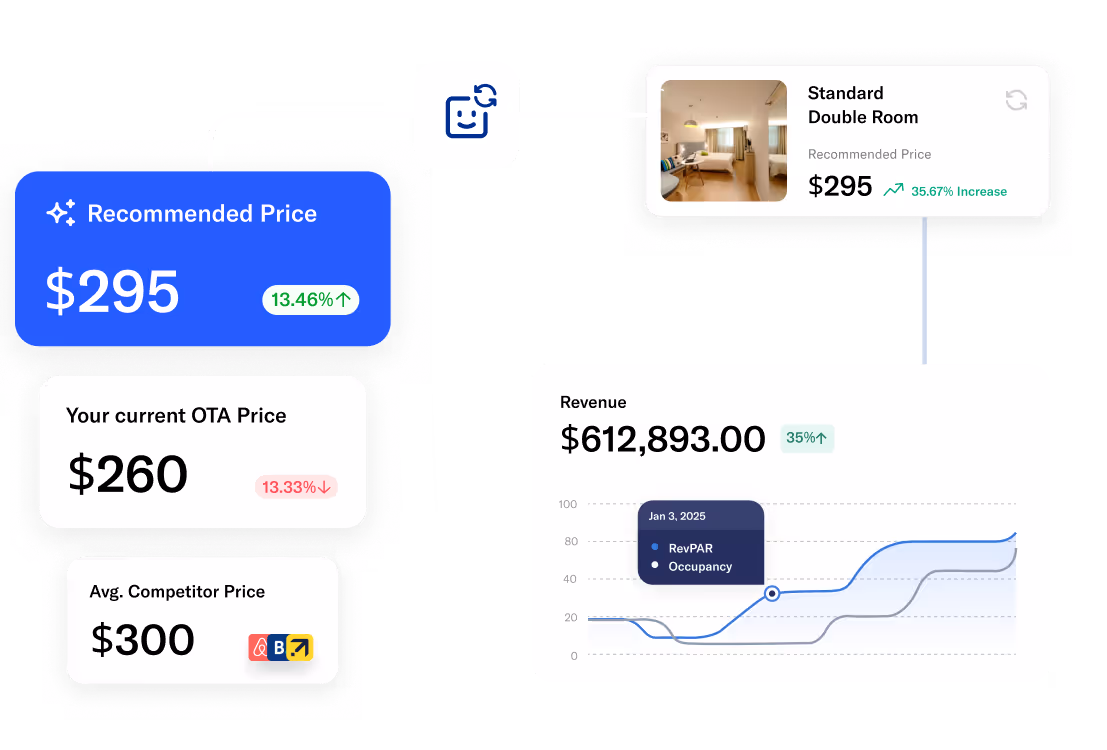
roommaster dashboards provide visual insights into revenue, operational efficiency, and guest behavior, so you can quickly see strengths and pinpoint gaps in your strategy.
Finally, turn insights into action. Adjust pricing, marketing, and operational strategies to improve performance. With roommaster PMS, you can implement changes seamlessly across reservations, rate plans, and distribution channels.
The platform supports smarter decisions, reduces manual work, and helps you execute strategies that increase revenue and enhance the guest experience, all from one connected system.
A STAR report gives you the information you need to understand your hotel’s performance and make smarter, revenue-focused decisions.
To use it effectively, focus on trends, index numbers, and year-over-year comparisons, and link each observation to practical actions that strengthen your market position.
Start by checking your hotel’s metrics against competitors and the market, which helps you understand your relative performance.
Index numbers show whether you outperform the compset, so track changes over time to see whether shifts affect only your hotel or the wider industry.
Compare current results to the same period last year to account for seasonality. Growth over time shows steady improvement.
If performance drops, examine external factors like tourism trends or consumer spending. If no external cause exists, consider adjusting pricing, marketing, or guest acquisition strategies.
Note patterns, strengths, and weaknesses revealed in your report.
Use these insights to guide decisions that increase occupancy, ADR, and RevPAR and strengthen your hotel’s market position.
The STR report does not exist to overwhelm you with numbers. It shows whether your hotel compares favorably against similar hotels and strengthens your pricing strategy.
When you review benchmarking consistently, you see how market trends shift, which helps you make smarter operational decisions and deliver a better guest experience. roommaster PMS puts these insights into practice.
By combining reservations, revenue management, and reporting in one unified platform, it gives independent hoteliers full visibility and control. You can track key metrics, identify opportunities, and act quickly to improve occupancy, ADR, and RevPAR, all from one intuitive dashboard.
Book a demo with us today and see how unified data and actionable insights can elevate your hotel’s performance.
{{cta-strip}}
STR stands for Smith Travel Research. In hospitality, it refers to benchmarking reports that compare a hotel’s performance against competitors and market averages.
Hotels receive STAR reports weekly, monthly, or daily depending on subscription level. Most properties rely on monthly summaries for strategic planning.
STR stands for Smith Travel Research, the organization that compiles anonymized hotel performance data and produces benchmarking reports.
Hotels must apply through STR, submit required data, such as occupancy and ADR, and agree to participate in regular reporting.
Hotels do not write STR reports manually. STR compiles data from participating hotels and generates standardized benchmarking reports.
Yes. Hotels can request comp set adjustments through STR, though approval depends on market alignment and confidentiality rules.
Internal PMS reports track operational and financial performance within the property. STR reports benchmarks that performance against the competitive market.
The transition to roommaster is straightforward and efficient. Our implementation team handles data migration including reservations, guest profiles, and historical information.
See how roommaster's unified platform can work for your property. Our team will walk you through features tailored to your specific needs and operations.